Comparing Proportional Relationships: Tables, Graphs, and Equations
Learn how to compare proportional relationships and decide which one has the greater constant of proportionality or unit rate using tables, graphs, and equations.
You get two job offers. Job A pays $60 for 4 hours. Job B pays $72 for 6 hours. Which one pays better per hour?
Both are proportional relationships — each follows with no added fees or base pay. But they have different values. Your job is to find which is larger and decide.
Here's how to compare proportional relationships in any format.
The Rule: Bigger Wins
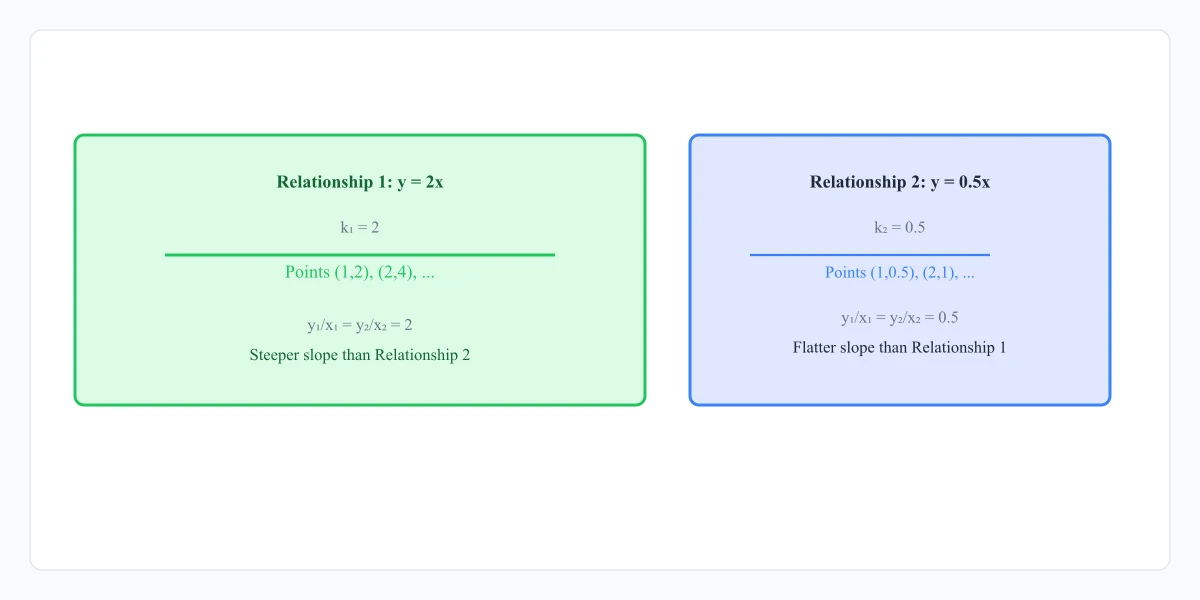
Every proportional relationship has a constant of proportionality . In a comparison, the relationship with the larger is always faster, steeper, pricier, or denser depending on the context.
If , then for the same , . That's the entire idea.
Comparing from Two Tables
Find for each table by dividing by . Then compare.
| | Job A: | | :-: | :-: | | 4 | $60 | | 6 | $90 | | 8 | $120 |
| | Job B: | | :-: | :-: | | 4 | $48 | | 6 | $72 | | 8 | $96 |
Job A: . Job B: .
, so Job A pays more per hour ($15/hr vs $12/hr).
Check the units. is in dollars per hour. That tells you what you're actually comparing.
Another Table Example
Compare these two speed relationships:
| Time (hr) | Car X: Distance (mi) | | :-: | :-: | | 2 | 120 | | 5 | 300 |
| Time (hr) | Car Y: Distance (mi) | | :-: | :-: | | 3 | 135 | | 7 | 315 |
Car X: mph. Car Y: mph.
Car X is faster. Its is larger.
Comparing from Two Graphs
The steeper line has the larger .
A graph of a proportional relationship is a straight line through . The slope of that line is . Steeper slope = larger = faster change.
Compare two lines:
- Line A passes through →
- Line B passes through →
Line A is steeper. Its is larger.
If both lines are on the same set of axes, the one that rises faster (is more vertical) wins. No calculation needed — just look.
One warning: the axes must use the same scale. A graph with a compressed -axis can make a slow relationship look steep.
Comparing from Two Equations
This is the easiest case. is the coefficient of .
| Equation | | | --- | :-: | | | 4 | | | 2.5 | | | 2.5 |
Which equation represents the greater constant of proportionality?
. First equation wins.
What about fractions and decimals?
Convert or compute: . . The first wins — barely.
Comparing Across Formats: Table vs Graph vs Equation
You won't always get two tables or two graphs. Sometimes you get one of each. The method is always the same: find and compare.
| Source | Data | | | --- | --- | :-: | | Table | | | | Graph | Line through | | | Equation | | 4.5 |
Ranking from largest to smallest: table () > equation () > graph ().
The process never changes:
- Extract from each representation.
- Put them side by side.
- Pick the largest.
Real-World Comparisons
Job offers. Two friends compare summer jobs. Miguel earns . Priya's earnings table shows $44 for 4 hours (). Miguel earns more per hour ().
Grocery prices. Store A: $3 for 12 ounces ( per ounce). Store B: ( per ounce). Store A is cheaper.
Typing speeds. A graph shows Kara's line passing through — she types 40 words per minute. Lin's equation is — 55 words per minute. Lin is faster.
Key Insight
The constant of proportionality converts "how many units of " into "how many units of ." A larger means more per . That translates to:
- Higher pay per hour
- Faster speed per hour
- Higher cost per ounce
- More production per batch
Always ask: "What does measure here?" Then larger = more of that thing.
Free practice worksheet
Get a printable "Comparing Proportional Relationships Pack" worksheet delivered to your inbox.
Practice Problems
1. Compare these two tables. Which has the larger ?
| | Relationship P | Relationship Q | | :-: | :-: | :-: | | 3 | 18 | 12 | | 7 | 42 | 28 |
Find for each. Hint: divide by for either row.
2. Two graphs show proportional lines. Line M passes through . Line N passes through . Which has the larger ?
Think about slope: divided by .
3. Which is the more expensive per ounce: a equation or a table showing $2.50 for 10 ounces?
Find both unit rates. Compare.
Get free math resources
Join our newsletter and receive printable worksheets, practice sets, and tips for mastering proportional relationships.
No spam. Unsubscribe anytime.
FAQ
How do you compare proportional relationships from a table? Find for each table by dividing by using any row where . The table with the larger has the stronger relationship.
What does it mean if one graph is steeper than another? The steeper line has a larger — a higher constant of proportionality. For the same , the steeper line produces more .
Can you compare a proportional and a nonproportional relationship? Yes, but only for specific values. A proportional relationship follows ; a nonproportional one follows . At , the proportional gives while the nonproportional gives . For large , the relationship with the larger coefficient eventually wins.
What if is negative in one relationship? A negative means decreases as increases. A positive (even a tiny one like ) is "larger" than any negative .
How do you compare proportional relationships in a word problem? Extract the from each situation. A job paying $18/hour () pays more than one paying $15/hour (). A car going 70 mph () is faster than one going 55 mph ().
Do the axes need to be the same scale when comparing graphs? Yes. Different axis scales can make a slower relationship appear steeper. Always check the units and scale before comparing steepness visually.
If two proportional relationships have the same , are they the same? They have the same rate, but they could represent different contexts. could mean 5 dollars per hour or 5 miles per hour. The math is identical, but the real-world meaning differs.
What's the quickest way to compare two proportional relationships? Convert each to form. The equation gives you directly. For tables and graphs, compute from one data point. Then compare the numbers.
Still stuck?
Get one-on-one help from a verified math tutor. Wyzant connects you with expert tutors who can walk you through proportional relationships step by step.
Find a math tutorRelated: Study the constant of proportionality in detail, or see how slope connects to proportional relationships. Use the unit rate calculator or constant of proportionality calculator to check any comparison.
ProportionalRelationship Team
Math educator and content creator at Proportional Relationship.
Get free math resources
Join our newsletter and receive printable worksheets, practice sets, and tips for mastering proportional relationships.
No spam. Unsubscribe anytime.
Still stuck?
Get one-on-one help from a verified math tutor. Wyzant connects you with expert tutors who can walk you through proportional relationships step by step.
Find a math tutor