How to Teach Proportional Relationships Clearly
Use practical lesson ideas, visual aids, and practice structures to teach proportional relationships more clearly to middle school math students.
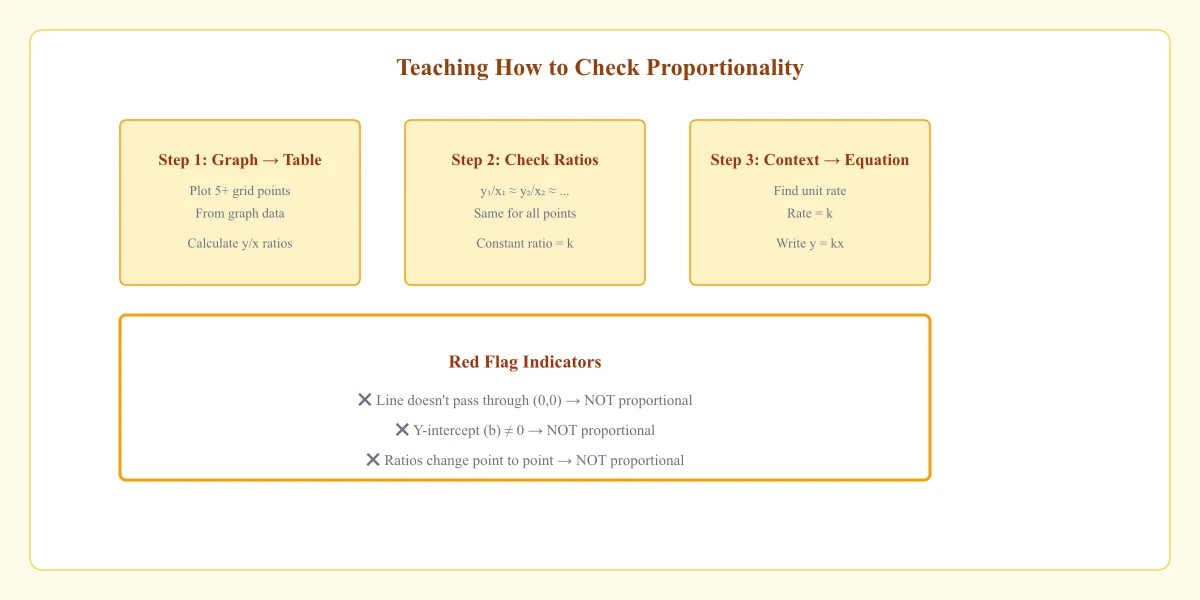
You're three days into your proportional relationships unit. You've explained the definition twice. Students can recite "y = kx" on cue. But when you hand them a table with fractional values, half the class freezes.
This unit is the gateway to 8th-grade slope, linear functions, and beyond. Here's a 5-day sequence that builds from concrete shopping comparisons to abstract — with the misconceptions addressed before they take root.
The Concrete-to-Abstract Progression
Proportional reasoning is abstract. Students understand "which is the better deal" long before they understand "constant of proportionality." Start there.
Day 1: Unit Rate and Comparison Shopping
Walk in with two bags of oranges. Bag A: 5 oranges for $4. Bag B: 8 oranges for $6. Which is the better deal?
Students instinctively want to compare, but they don't have a method yet. Show them:
Bag A: \frac{4}{5} = \0.80\frac = $0.75$ per orange. Bag B wins.
Give them 5-6 shopping scenarios — pounds of apples, packs of pencils, liters of gas. Every scenario reinforces the same move: divide to find the rate per 1. That's .
Free practice worksheet
Get a printable "Proportional Relationships Practice Pack" worksheet delivered to your inbox.
Day 2: Tables and the Ratio Test
Now formalize. Hand out a table with and values. Show them the ratio test:
| | | | | :-: | :-: | :-: | | 2 | 8 | 4 | | 5 | 20 | 4 | | 7 | 28 | 4 |
Every row gives 4. Same . Proportional.
Then plant a trap table:
| | | | :-: | :-: | | 1 | 3 | | 2 | 5 | | 3 | 7 |
, , — ratios don't match. Not proportional.
Key teaching point: Students want to look at differences between values (+5, +8, +11) and guess. Force them to divide every time. The difference trick gives wrong answers.
Day 3: Graphs and the Origin Rule
Take a proportional table and graph it. The points form a straight line. Then graph a non-proportional table — still a straight line.
This is where the origin rule lands. Put two graphs side by side:
- Graph A: Straight line through . Proportional.
- Graph B: Straight line through . Not proportional.
Anchor chart for the wall:
Proportional Graph Test
- Is it a straight line?
- Does it pass through ?
Yes to both = proportional. Anything else = no.
Students need to see 8-10 graphs in one lesson. Mix proportional and non-proportional. Have them sort.
Day 4: Equations in Form
By now, students have found from tables and graphs dozens of times. Writing the equation is a short leap.
If , the equation is . If , the equation is .
Show and ask: proportional? The means when , . That breaks the origin rule.
Day 5: Mixed Practice and Assessment
Give students a mix of tables, graphs, equations, and word problems. Can they identify proportional relationships across all four representations?
Example exit ticket:
A car travels 180 miles in 3 hours at constant speed. Is this proportional? Write the equation.
. Equation: . Proportional.
Common Misconceptions and How to Address Each
"Straight line = proportional." Show a graph of . Straight line. Ask: through the origin? No. Not proportional.
"I can check by looking." No. Divide. Every time. Make division the automatic reflex.
"The constant of proportionality is the first I see." Given , some students grab instead of dividing. Drill: , not .
"Bigger jumps mean it's not proportional." A table jumping from to looks suspicious. But and . Same . Proportional.
" has to be a whole number." Run a table where or . Watch heads spin. Show them can be any real number.
"Proportional means the graph goes up." A line with goes down but still passes through . Still proportional.
Visual Aids and Anchor Charts
Wall posters that stay up all unit:
- The Three Tests: Table (divide by ), Graph (straight line + origin), Equation ( form)
- Is Everywhere: Arrows from tables, graphs, equations, and word problems all pointing to
- Proportional vs. Not: Side-by-side examples of each representation
Differentiation Tips
Remediation: Stick to whole-number values. Use graph paper with large grids. Let students use calculators — the skill is recognizing constant ratio, not arithmetic fluency.
Enrichment: Give students a word problem with no numbers. "Describe a situation where two quantities are proportional. Write the equation. Graph it." Push them to explain why proportionality matters in science class (speed, density, concentration).
Assessment Ideas
- Exit ticket (5 min): One table, one graph, one equation. Proportional or not? Find .
- Quiz (20 min): Mix of all four representations plus one comparison question (which has a larger ?).
- Project: Find a real proportional relationship outside of math class — grocery receipts, gas pump, recipe scaling. Write the equation, draw the graph, explain .
Standards Connection
7.RP.A.2a-d: Recognize and represent proportional relationships between quantities. Decide whether two quantities are in a proportional relationship (). Identify the constant of proportionality. Represent proportional relationships by equations.
8th-grade bridge: The in becomes slope in next year. Emphasize this overlap. When students learn slope, remind them: "You already know this. It's just with a new name."
Get free math resources
Join our newsletter and receive printable worksheets, practice sets, and tips for mastering proportional relationships.
No spam. Unsubscribe anytime.
FAQ
How long should I spend on the concrete phase? At least one full day. Students who don't internalize unit rate will struggle with later. Let them compare prices until the division pattern becomes automatic.
What's the biggest mistake teachers make? Moving to equations too fast. Proportional relationships are fundamentally about constant ratio, not . The equation is the result, not the starting point.
Should I let students use calculators? Yes, for this unit. The cognitive load is the ratio test and the origin rule, not long division. Let calculators handle arithmetic so students focus on structure.
How do I handle students who reverse and ? Anchor to the concrete: " is what you're figuring out. is what you start with." In a speed problem, you start with hours () and figure out distance (). is distance per hour.
What's the most effective intervention for struggling students? Same-day feedback on the ratio test. Give a 3-row table, have them compute for each row, and check before they leave. One wrong ratio? Fix it now, not tomorrow.
How does this connect to 8th grade? in is the same as slope in . The only difference is the — which appears in 8th grade. Students who master proportional relationships have a massive head start on linear functions.
Should I teach inverse proportions in this unit? No. Stick to direct proportion. Inverse proportion () appears later and confuses students who are still building the direct proportion schema.
How do I know if students are ready to move on? Give them a mixed set of 10 items (tables, graphs, equations, word problems). If they can correctly identify proportional vs. non-proportional with 80% accuracy, they're ready.
Still stuck?
Get one-on-one help from a verified math tutor. Wyzant connects you with expert tutors who can walk you through proportional relationships step by step.
Find a math tutorRelated: Check student work with the table checker, graph checker, or equation checker. Download the proportional relationships practice pack for ready-to-use worksheets.
ProportionalRelationship Team
Math educator and content creator at Proportional Relationship.
Get free math resources
Join our newsletter and receive printable worksheets, practice sets, and tips for mastering proportional relationships.
No spam. Unsubscribe anytime.
Still stuck?
Get one-on-one help from a verified math tutor. Wyzant connects you with expert tutors who can walk you through proportional relationships step by step.
Find a math tutor