How to Tell if a Graph Is Proportional
See how to identify proportional graphs by checking the origin, slope, and equivalent ratios — with visual examples and a free interactive checker.
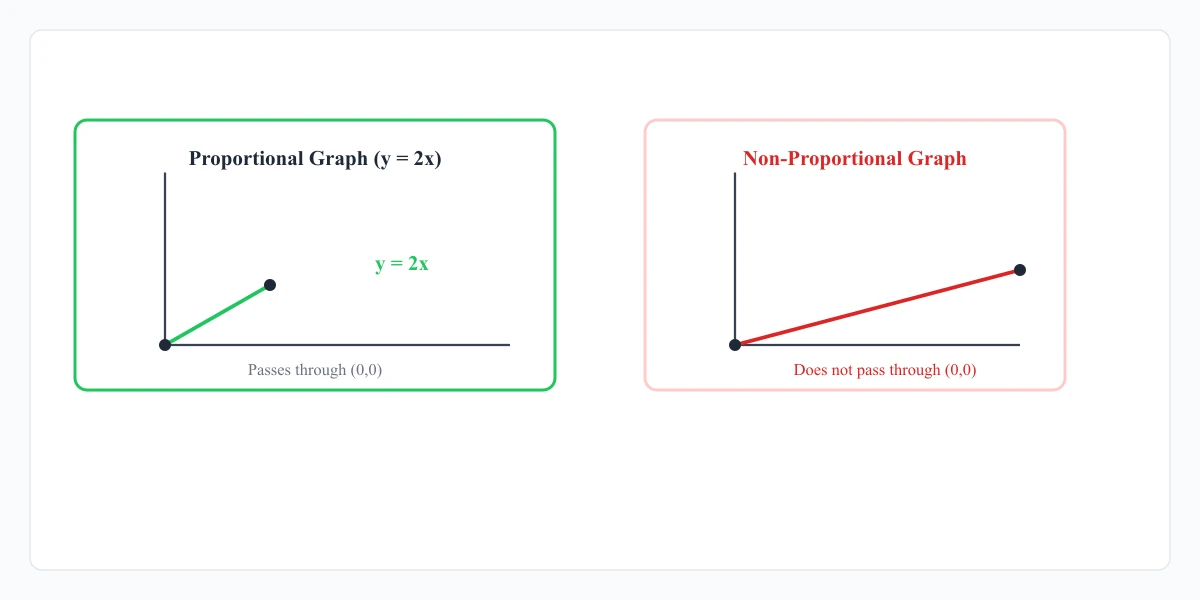
You're looking at a graph on a test. Two lines. One goes through , the other starts at . They look almost the same. Which one is proportional?
The Two Rules for Proportional Graphs
A graph shows a proportional relationship when it meets both conditions:
- The graph is a straight line.
- The line passes through the origin .
That's it. If either condition fails, the relationship is not proportional.
Rule 1: Straight Line
A proportional relationship has a constant rate of change. On a graph, that always looks like a straight line — no curves, no bends.
✅ Proportional: A straight line. ❌ Not proportional: A curve, parabola, or any non-linear shape.
Rule 2: Through the Origin
This is the rule students miss most. A straight line that doesn't pass through is not proportional — even though it looks almost identical.
The origin rule comes from the equation . When , must be :
If there's any constant added (), then when , . The line shifts up or down, and proportionality breaks.
Free practice worksheet
Get a printable "Proportional Graphs Practice" worksheet delivered to your inbox.
Visual Examples
Proportional graph: A straight line through ascending at a constant angle — like .
Non-proportional graph (trap #1): A straight line through ascending at the same angle — like . Same slope, shifted up. Not proportional.
Non-proportional graph (trap #2): A curved line that happens to pass through the origin — like . Passes through , but it's not a straight line. Not proportional.
The Point Test
If you only have a graph (no table, no equation), you can still check proportionality by picking points.
- Pick any two points on the line where .
- For each point, divide by .
- If both divisions give the same number, the graph is proportional.
For a graph of :
- Point :
- Point :
Same ratio. Proportional. For :
- Point :
- Point :
Different ratios. Not proportional.
Why This Matters in Math Class
Proportional graphs are the foundation for slope, linear functions, and eventually calculus. Every 7th-grade standards-aligned curriculum tests this exact skill:
- Is the line straight?
- Does it go through the origin?
- What is the constant of proportionality (the slope)?
Use our graph proportional checker to upload points and see an instant result.
FAQ
Can a proportional graph be a horizontal line? Only if it's (the x-axis). A horizontal line like has slope 0 and doesn't pass through the origin.
Can a proportional graph be a vertical line? No. A vertical line like isn't a function, and it doesn't pass through .
What if the graph shows points that aren't connected? The points should form a straight line pattern through the origin. If they do, the data represents a proportional relationship.
Does the line have to go through exactly? Yes. Even a line that goes through fails the origin test. In math class, precision matters.
How is slope related to proportional graphs? In a proportional graph, the slope equals the constant of proportionality . Read more in slope and proportional relationships.
Still stuck?
Get one-on-one help from a verified math tutor. Wyzant connects you with expert tutors who can walk you through proportional relationships step by step.
Find a math tutorRelated: Check any table with our proportional table checker, or use the constant of proportionality calculator to find in seconds.
ProportionalRelationship Team
Math educator and content creator at Proportional Relationship.
Get free math resources
Join our newsletter and receive printable worksheets, practice sets, and tips for mastering proportional relationships.
No spam. Unsubscribe anytime.
Still stuck?
Get one-on-one help from a verified math tutor. Wyzant connects you with expert tutors who can walk you through proportional relationships step by step.
Find a math tutor